Detections
People, light/civil vehicles and site-specific vehicles, on demand.

Solutions · AI Monitoring & Reporting
An analytics dashboard that turns your timelapse photos into site-specific data on productivity, safety and project progress.
CH.01 Live demo
Analytics identify people, vehicles and plant in the photos your camera already takes, then present them as trends, interactive graphs and heat maps.
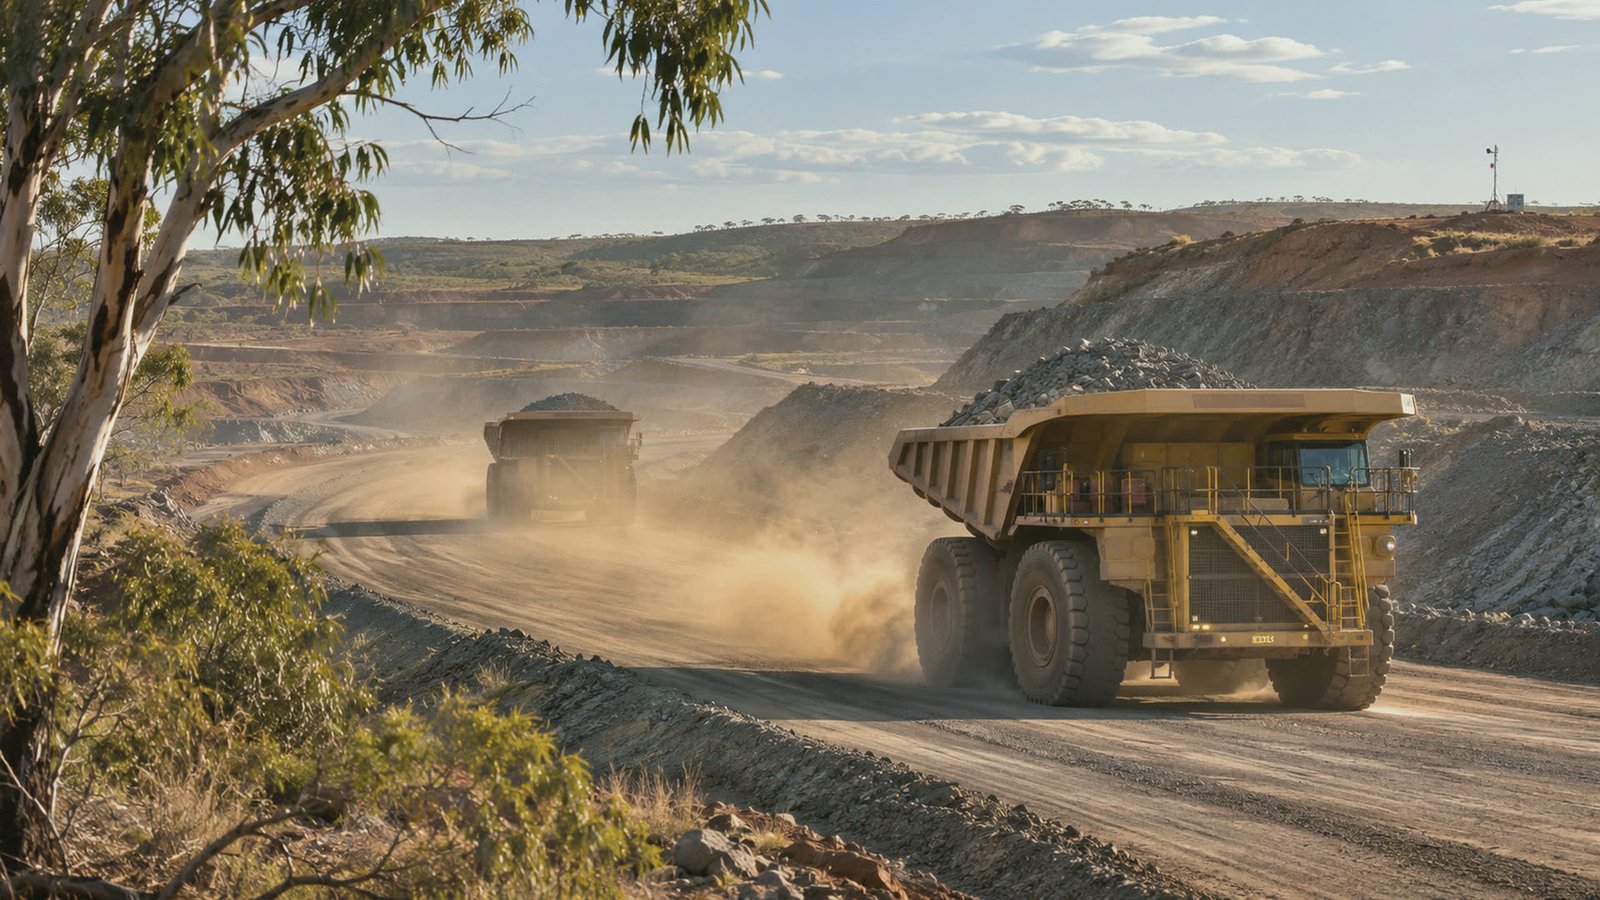
Illustrative demo · Detections update every frame
CH.02 Platform features
People, light/civil vehicles and site-specific vehicles, on demand.
Measures site activity within the parameters you set.
PPE use, including hard hats and hi-vis, scored against your KPIs.
Density and spatial distribution of people and vehicles.
Interactive graphs that compare date ranges and track change over time.
Select and analyse one or more areas of the site.
People and sensitive areas blurred automatically for privacy.
Branded client portal, custom exports and an API into your own systems.
CH.03 Remote site monitoring
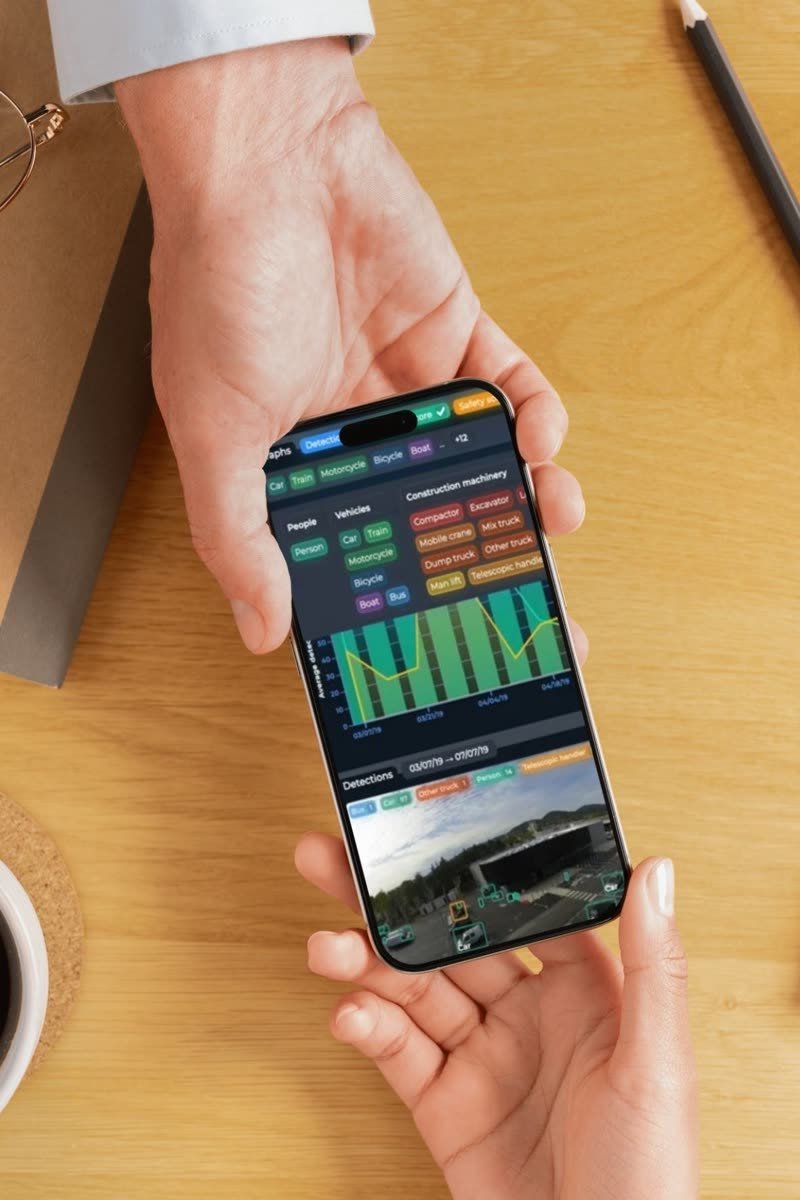
Monitor your site any time, from anywhere, on any device. You and your stakeholders can follow progress, review galleries and check live data without setting foot on site.
Premium packages add a dedicated account manager and engineer, AI reporting and advanced analysis tools, so the insights reach the people who act on them.
CH.04 Usage applications
Ensure PPE and site compliance, identify and mitigate risks, and track trends to improve efficiency and workflow.
Monitor processes against design, catch deviations early, and keep a visual record for audits, insurance and warranty.
Track progress against planned timelines, resolve scheduling conflicts and coordinate subcontractors.
Transparent, real-time updates and visual progress reports that strengthen trust.
CH.05 · Demo
Book a demonstration and we'll walk you through detections, scoring and reporting with real project data.
Request a demo